Thursday 1st September 2022
Pounding the Table for Small-Caps

We think small-cap investors are well-advised to follow the investment maxim, "Look to be fearful when others are greedy and greedy when others are fearful."
We can appreciate that global small-cap investors, having just endured the worst first half in the more than 40-year history of the Russell 2000 Index, a loss of 23.4 per cent, may be reticent to put fresh capital to work in the asset class.
We also understand the weariness and anxiety of investors as they contemplate the current landscape of potential recession, multi-decade highs in inflation, an aggressive Federal Reserve, and continued geopolitical turmoil. There seem to be many good reasons not to invest now. Yet that perception is exactly why we are so emphatic that, based on a collection of indicators that we watch, this looks like an extremely attractive time to invest in small-caps, particularly if an investor uses large-cap stocks as the source of funds.
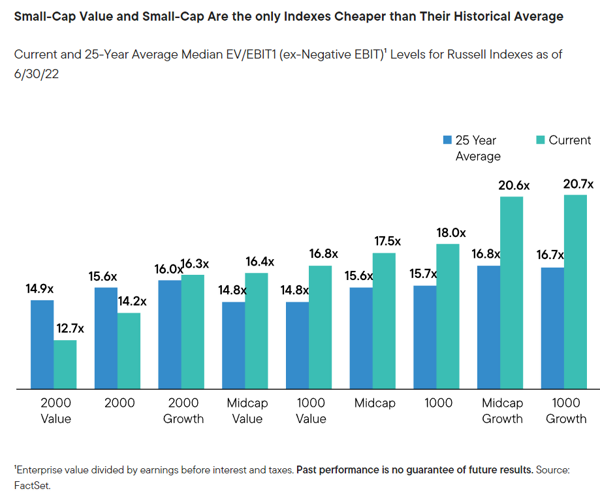
Let’s begin with some observations about current valuations within the U.S. equity market that we think reveal some unappreciated insights. The chart below features two components; current valuations, measured with our preferred metric of enterprise value divided by earnings before interest and taxes and a comparison to the 25-year average of the same metric for the nine size/style segments of the U.S. equity market (e.g., small/mid/large, value/core/growth) as proxied by the relevant Russell Index.
To our eyes, five salient insights appear:
1) The Russell 2000 Small-Cap, Value, and Core Indexes are the cheapest segments of the U.S. market;
2) These are the only segments that are below their 25-year average valuation;
3) While all three value segments across the capitalization ranges of small-, mid-, and large-cap have nearly identical 25-year average valuations, their current valuations are vastly different;
4) The Russell 2000 and 1000 Indexes have nearly identical 25-year average valuations, yet quite different current valuations; and
5) Large-Cap and Mid-Cap Growth valuations still have a long way to go before reaching their 25-year average valuations.
These valuation differences are particularly relevant now because it seems likely to us that U.S. equity valuations have hit their peaks for many years to come. Our view is that a future environment featuring somewhat higher interest rates and inflation, along with a less accommodative Federal Reserve and increased geopolitical rivalries, combine for a greater risk environment. This new climate will therefore probably see somewhat lower equity valuations than we have seen over much of the last ten years. The investment consequence of this view is that investors should allocate away from higher valuation assets, which may have stiff headwinds to appreciation, into lower valuations assets, which may benefit from at least a neutral environment or perhaps modest tailwinds.
We next examine a less well-known dynamic between large- and small-cap stock performance as investor fear waxes and wanes. We have found it useful to monitor the CBOE S&P 500 Volatility Index “VIX” as a barometer for risk tolerance. Long-time investors will know that risk tolerance ebbs and flows with various events. However, regardless of the event (e.g., Long-Term Capital Management’s 1998 meltdown, 9/11, the Great Financial Crisis of 2008-09, the Greek Debt Crisis in 2011, 2020’s COVID shutdown), risk tolerance initially plummets before investors show their resilience and acclimatize to the new development, leading to a normalizing of risk tolerance.
This is the history of markets. Yet there’s also a consistent pattern within U.S. equities as small-cap stocks seem to absorb a greater proportion of heightened fear than large-caps as stock prices fall. However, this phenomenon creates a potential opportunity, as the chart below highlights. Periods of high investor anxiety, as proxied by the VIX index, have historically been attractive entry points for absolute small-cap returns and, even better, often excellent entry points for small-cap outperformance over large-caps. When the VIX has had an average monthly reading of 25 or more, as it did in June, the subsequent three-year annualized returns for small-caps have been 14.1 per cent, compared with 9.2 per cent for large-caps. Even more striking than the spread of outperformance has been the batting average – that is, the frequency of time when small-caps have beaten large-caps over the subsequent three years from similar staring points – which is 83 per cent. We have characterized small-caps as being similar to a coiled spring in times of high investor anxiety, contracting more as fear increases and bouncing back more robustly as fear recedes.
There’s another subtle aspect of the small-cap asset class that highlights its breadth and heterogeneity.
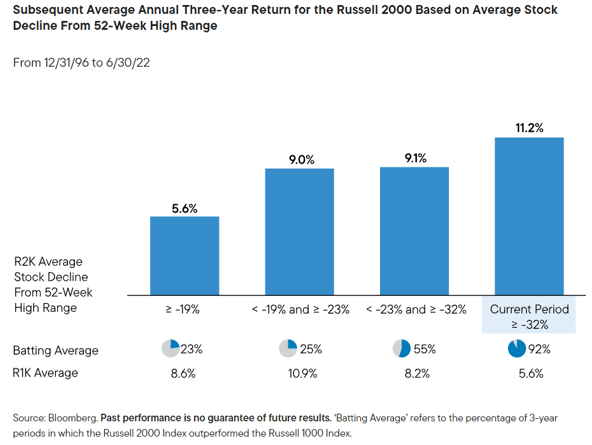
It is common to use indexes as proxies for asset classes – as we do with the Russell 2000 – but indexes are a very rough guide. For a large universe of companies with a variety of idiosyncratic developments, the performance of an index may obscure what else is going on in the overall universe. We have found this dynamic often manifests itself in small-cap market declines in which the index decline often understates the peak to trough decline of the average stock. We have calculated the past patterns of the decline of the average stock in the Russell 2000 from respective 52-week highs, and then the subsequent returns based on the depth of decline starting point.
As can be seen in the chart below, and as might be expected, the deeper the decline for the average Russell 2000 stock, the higher the subsequent average return. However, echoing the observation we made above about small-caps’ relative returns from periods of heightened fear, the batting average of small-caps beating large-caps over the subsequent three-year following deep decline periods, has been an impressive 92 per cent. Those observations were from all subsequent three-year periods when the average Russell 2000 stock was down 32 per cent or more from respective 52-week highs. The current small-cap market is in an even more depressed state. While the Russell 2000 was down 29.5 per cent from its 52-week high at quarter end, the average small-cap stock was 44 per cent off its 52-week high.
From our perspective, this triumvirate of historically grounded observations – small cap’s superior valuation, the history of small-cap outperformance following high fear moments, and the relative outperformance of small-caps from points of deep decline – make a compelling, if not table pounding, case for putting fresh capital into small-caps now, possibly using large cap as a source of funds.
We think small-cap investors are well-advised to follow the investment maxim, “Look to be fearful when others are greedy and greedy when others are fearful.”