Thursday 30th June 2022
Turbulence ahead

After months of fretting about soaring inflation, markets are now fully in recession-fear mode.
After months of fretting about soaring inflation, markets are now fully in recession-fear mode. Yield curves are flattening, credit spreads are widening, and equities are slumping—traditional recession alerts. Meanwhile, captains of industry and finance are warning of impending “hurricanes,” “super bad feelings”—and possibly even worse.
The proximate cause of the latest market selloffs was the May US Consumer Price Index report, which came in hotter than expected in both headline and core terms.1 It also presented an unnerving picture of broadening price pressures across the economy. Investors responded by ratcheting up expectations for Federal Reserve (Fed) rate hikes, and the Fed responded by increasing rates 0.75% Wednesday, with another potential 0.75% in July and more increases beyond that.
Investors were already rattled by the recent monetary policy U-turn from the European Central Bank (ECB), which abruptly shifted from a cautious to an unambiguously hawkish stance. The ECB is now expected to raise interest rates a quarter-point in July, with additional and potentially larger moves in the autumn. The ECB will now join some 80% of major central banks in raising rates in 2022.2
Soft landings are uncommon
History is unkind to the notion of “soft landings.” When central banks jack up interest rates, rising unemployment and recessions typically follow. According to a New York Federal Reserve study, in 11 out of 15 tightening cycles since 1955, the US unemployment rate has risen, in most of those cases leading to recession.3 Tightening cycles are also frequently accompanied by financial stress, failure, or crisis. When inflation is this high and this many central banks are tightening simultaneously, the odds of slowing inflation without high economic or financial cost are even lower.
In this piece, we look at various financial and economic indicators to offer our own assessment of recession risk. We also provide insights into the likelihood of an earnings recession (i.e., an outright decline in reported corporate profits).
Our take? The rapidly shifting consensus is largely correct. While still not a certain outcome, the risk of recession is rising. And the odds of a corporate profit slump are even higher. Fasten seatbelts and hang on, there is turbulence ahead, and the landing looks dicey.
Looking for major turning points
Over time and across countries, business cycles have been studied extensively. Given their frequency, a relatively large number of recessions provides sufficient observations to use statistical analysis to discern how financial and economic indicators perform immediately before, during and after slumps. That allows statisticians to derive probabilities of future recessions over the next one or two years.
The Franklin Templeton Institute developed several models to gauge business and profit-cycle risks. The aim is not to forecast growth, inflation or corporate earnings, much less the usual ups and downs of financial markets. Rather, our tools allow us to gauge when major cyclical turning points may be arriving so that we can better advise our firm and its clients as they make their investment decisions.
Our work is based on careful analysis of how various financial and economic variables behave over the business cycle. Sifting through the candidates, there are about 10 indicators that have traditionally captured turning points in the economy: yield curves, credit spreads, consumer sentiment, business sentiment, broad measures of financial conditions, the labor market, purchasing manager indices, oil prices, housing activity and—for the United States—state-level measures of economic conditions.
Using basic statistical techniques, these measures can be used individually or in tandem to calculate at any given point in time the probability of a recession over the next 12 months.
Models, of course, are not infallible. Changes in the economy can alter the lead and lag times between indicators and outcomes. They can even make certain indicators less predictive. For instance, well-known disruptions to global goods consumption, production, and distribution patterns due to the COVID-19 pandemic may diminish the reliability of manufacturing surveys, such as purchasing manager indexes, for recession probability calculation. In all cases, quantitative models must be augmented by qualitative analysis.
Recession odds increase
What, then, do our indicators say about recession odds? Worryingly, our broad probability model suggests the odds of a US recession in the next 12 months have roughly doubled, from about 20% late last year to nearly 40% today.4 That’s roughly the same as a Bloomberg published model that uses a single input, the shape of the US Treasury yield curve. Even more distressing, Bloomberg’s two-year, multivariate recession probability model suggests the odds of a US recession over the next 24 months are now over 70%!5
The cycle in pictures
For some readers, it may be useful to highlight how key recession metrics look today and how they relate to past business cycles. In the following series of charts, we look at six key metrics that signal a recession: US Treasury yield curve, oil prices, consumer expectations, chief executive officer (CEO) sentiment, unemployment and rate hikes.
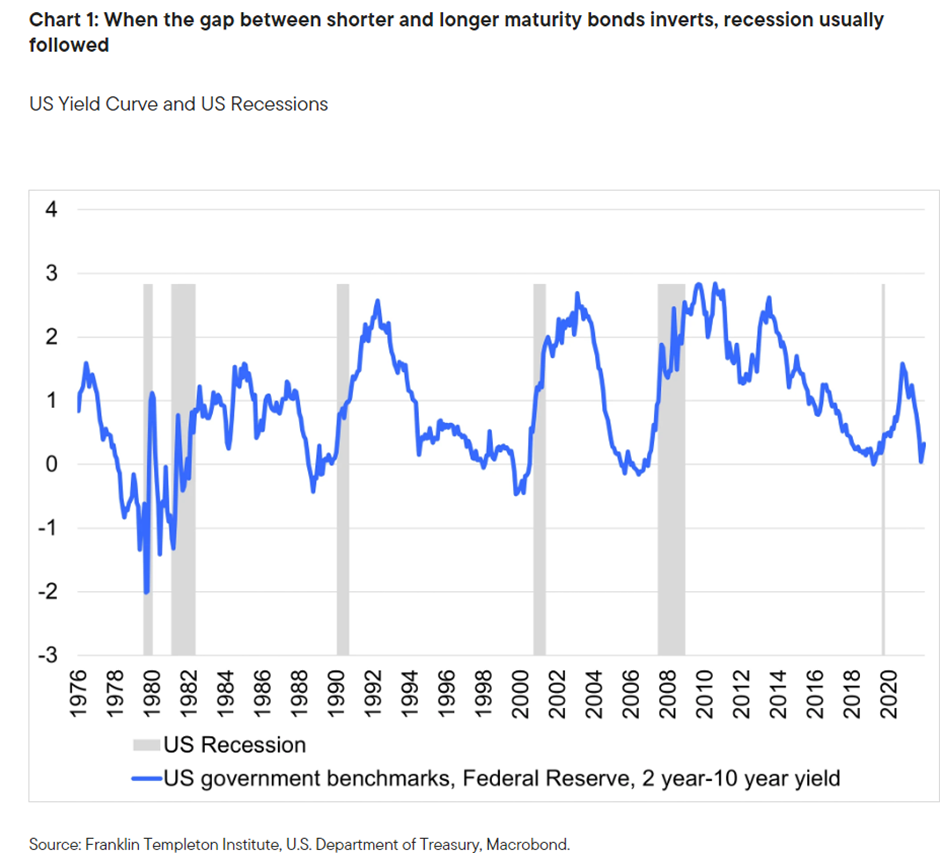
In Chart 1, we present the US Treasury yield curve spreads alongside prior US recessions, as indicated by the shaded regions of the chart. When the gap between shorter and longer maturity bonds flips (inverts) from positive to negative, the economy often dips into recession. Presently, the US yield curve has only flattened but has not decisively inverted, so this is a key indicator to watch in the weeks ahead.
Oil price spikes have also preceded seven of the past nine US recessions, as shown in Chart 2. Given the doubling of global crude oil prices over the past year, that ought to be a worrisome development for the year ahead.