Thursday 30th November 2023
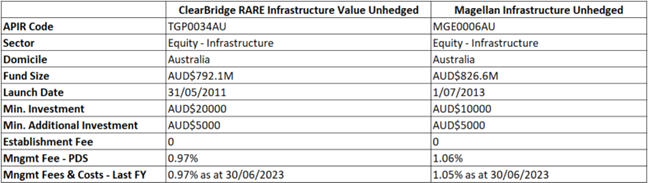
Leaders & Laggards: Magellan Global Infrastructure vs ClearBridge RARE Value Infrastructure
In this head-to-head battle, Atchison Consultants analyst Mishan Dahia pitches Magellan and Clearbridge against each other in an infrastructure performance match up. Which one leads, and which one lags?
Investment Approach
- ClearBridge aims to offer sustained, inflation-resistant growth over the long term. This growth encompasses steady income and capital appreciation while prioritising the reduction of return fluctuations.
- Magellan looks to make prudent investments in infrastructure at appealing valuations, showcasing reliable and predictable cash flows over the medium to long term while minimising capital losses.
5 Year Performance as of 31st October 2023
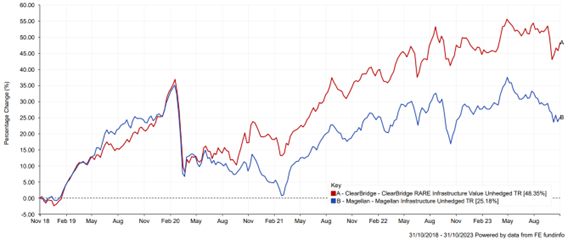
- ClearBridge (+2.3%) and Magellan (+1.2%) delivered positive returns in the month of October, both benefitting from holding Severn Trent, United Utilities and American Tower (assuming these positions were held for the entire month of October 2023).
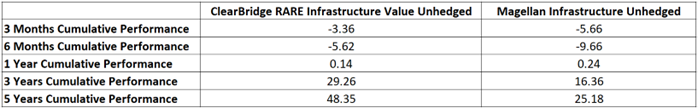
- Both funds experienced negative returns over three and six months, with ClearBridge showing less of a decline compared to Magellan.
- Over one year, ClearBridge returned 0.14% and Magellan slightly outperformed returning 0.24%.
- ClearBridge outperformed Magellan by 12.90% over 3 years and 23.17% over 5 years.
Risk Metrics as of 31st October 2023 – 1 year review
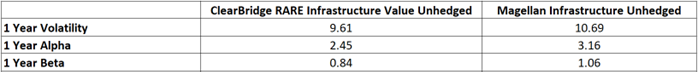
- Volatility measures the degree of variation in the fund’s returns. With a volatility of 9.61, ClearBridge exhibits lower fluctuations in its returns compared to Magellan.
- Alpha represents the excess return of the fund relative to its benchmark. ClearBridge has an alpha of 2.45, indicating it has generated a positive excess return. Magellan’s alpha is slightly higher at 3.16, suggesting a comparatively higher excess return above its benchmark over 12 months.
- Beta measures the fund’s sensitivity to market movements. ClearBridge has a beta of 0.84, indicating that it is less sensitive to market fluctuations compared to the benchmark. Magellan’s beta is higher at 1.06, signifying it is more reactive to market movements compared to ClearBridge.
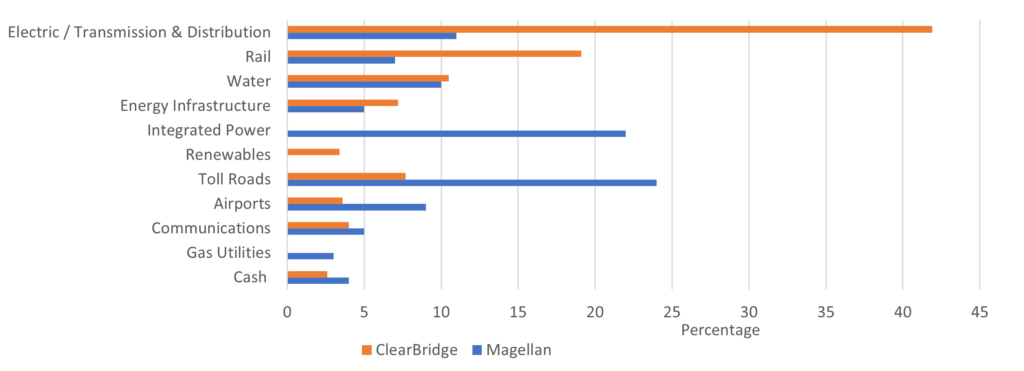
Sector Exposure
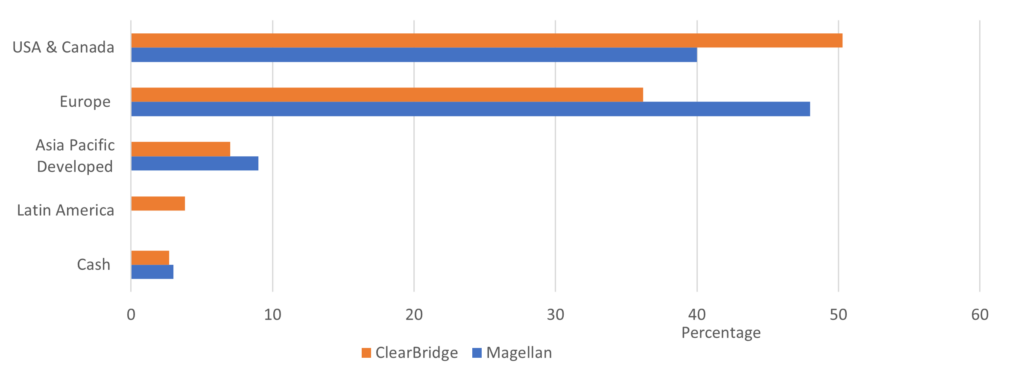
Regional Exposure
Top 10 Holdings
| ClearBridge | Magellan | |
| 1 | PG&E | Aena SME SA |
| 2 | Severn Trent | Ferrovial |
| 3 | Ferrovial | National Grid Plc |
| 4 | CSX | Norfolk Southern Corporation |
| 5 | GetLink | Sempra Energy |
| 6 | NextEra | Severn Trent |
| 7 | Enel SpA | Transurban Group |
| 8 | American Tower | United Utilities |
| 9 | PPL Corporation | Vinci SA |
| 10 | United Utilities | WEC Energy Group Inc |
Three of the top ten holdings for ClearBridge and Magellan are the same. The three-year correlation analysis produced a 0.94 from FE Analytics between the two funds, further highlighting the exceptionally strong positive relationship between the two funds movements.
Summary
ClearBridge has heightened exposure to Northern America, whilst Magellan holds increased exposure to Europe. From a holding’s standpoint, three of the top ten holdings for both Magellan and ClearBridge are the same, with FE Analytics highlighting a 0.94 three-year correlation between the two funds movements. When analysing sectors, ClearBridge holds significantly more exposure to Electric and Rail, whilst Magellan has heightened exposure to Integrated Power and Toll Roads.
ClearBridge is the LEADER over three and five years, demonstrating stronger growth and recovery capabilities, compared to the LAGGARD Magellan. However, over 12 months, Magellan has marginally outperformed ClearBridge.
*Important Note
Historical performance is not a true indicator of future performance. It’s essential to conduct your own due diligence, delving into underlying strategies, holdings, market conditions, along with understanding your clients’ goals and risk tolerances prior to making investment decisions. Leaders and Laggards are not investment recommendations, and only consider two funds within a sector, not the broader universe. Data sourced from FE Analytics and Fund websites.

Mishan is a columnist for The Inside Adviser and an expert on asset allocation and fund research.