Thursday 25th February 2021
Passive flows creating an opportunity for active managers

An illustration of why an active long-short approach to the global listed infrastructure (GLI) sector makes sense.
ESG funds have gained in popularity in 2020, sometimes with a material impact on underlying holdings. This has impacted GLI stocks recently, with the iShares Clean Energy ETF buying 1%-6% of companies’ floats in a matter of weeks, leading to excess returns of 19%-37%. These market dynamics, even in a sector with defensive characteristics like GLI, support an active and long-short approach to investing and managing risk.
ESG investing has gained momentum over the last decade, initially in Europe, then US, and more recently, in Asia. COVID-19 markedly increased social and environmental awareness in 2020 among investors, corporates and wider society, as well as pro-climate policy responses in the US, Europe and China. During 2020, active managers increasingly integrated ESG overlays into their investment processes across asset classes, ESG-dedicated active funds launched in record numbers and ESG ETFs had record inflows.
However, amid these record inflows and with a limited pool of pure-play green stocks to buy, often with low market capitalisations, it raises the question – is this a case of the tail wagging the dog? And what risks and opportunities does this create?
ESG Fund Flows
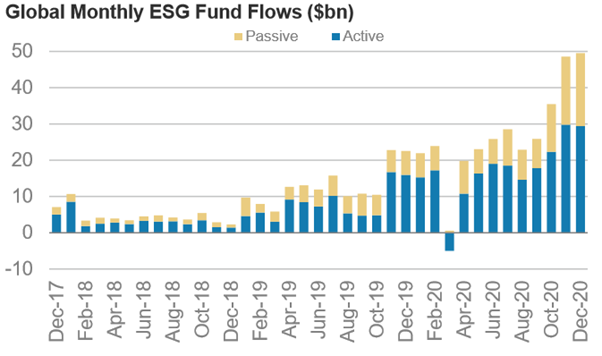
Monthly ESG fund flows hit record levels during Q4 2020, across both active and passive funds. This was driven by several converging factors, such as a greater portion of asset owners allocating to dedicated ESG active managers and retail investors increasing their use of ESG ETFs as a way to access this popular thematic.
Of the record US$1.4 trillion ($1.8 trillion) in ESG funds under management (FUM) at the end of 2020, European funds dominated, accounting for an 85% share. Of this ESG category, passive funds have grown to 23% of all ESG FUM, an increase of 10% over the last three years.
iShares Clean Energy ETF
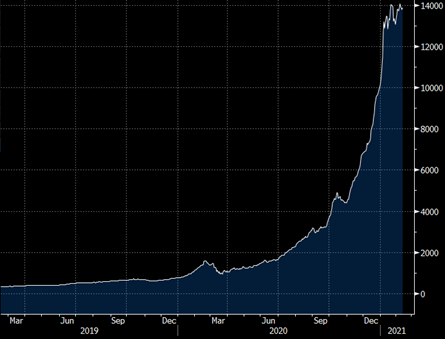
One of the largest Clean Energy ETFs is the iShares Global Clean Energy ETF, listed on the New York and London stock exchanges (ICLN US & INRG LN tickers), with a combined AUM of US$14 billion ($17.7 billion) across 30 stocks (as of 10/2/21). This is up from US$0.76bn at the end of 2019 and US$4.4 billion at end of October 2020 (see Chart 2).
There were two main catalysts that spurred a surge in inflows in December 2020 and January 2021 into this ETF. Firstly, on December 21 in the US, Congress voted through a US$900 billion ($1.1 billion) Coronavirus Relief Package, that included extensions to production tax credits for onshore wind projects and investment tax credits for solar.
Secondly, the Democrats’ clean sweep at the Georgia run-off on January 6 was met with the expectation of more green stimulus being legislatively possible. Large inflows such as these can lead to distortions in the market – and this was evident across GLI stocks. For example, over the four weeks to the 22nd January 2021, the fund was a net buyer of A$3.6 billion across these 30 stocks. For the five core GLI universe names in the ETF (25% aggregate weight), this was effectively trading an average 52% of average daily volume (ADV) for each stock for every day for the entire four weeks (compared to prior undisturbed three-month ADV).
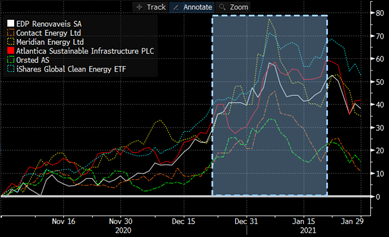
The impact of these flows was further exacerbated by thin trading in early January, and the non-discretionary style of ETF implementation in buying the underlying stocks. The sheer size of these flows can then push the underlying share prices beyond fundamental valuations very quickly – as can be seen in Chart 3 above, with share prices up between 20%-50% over the four weeks.
On a granular level, the impact is even more staggering. For example, Chart 4 below shows that during the four weeks in question, the ETF bought a total of $145 million worth of EDP Renovaveis, which was an average 59% ADV of buying for four straight weeks, and buying net 2.7% of the free float of the company. This led to an excess return of 21% over the local index during that period.
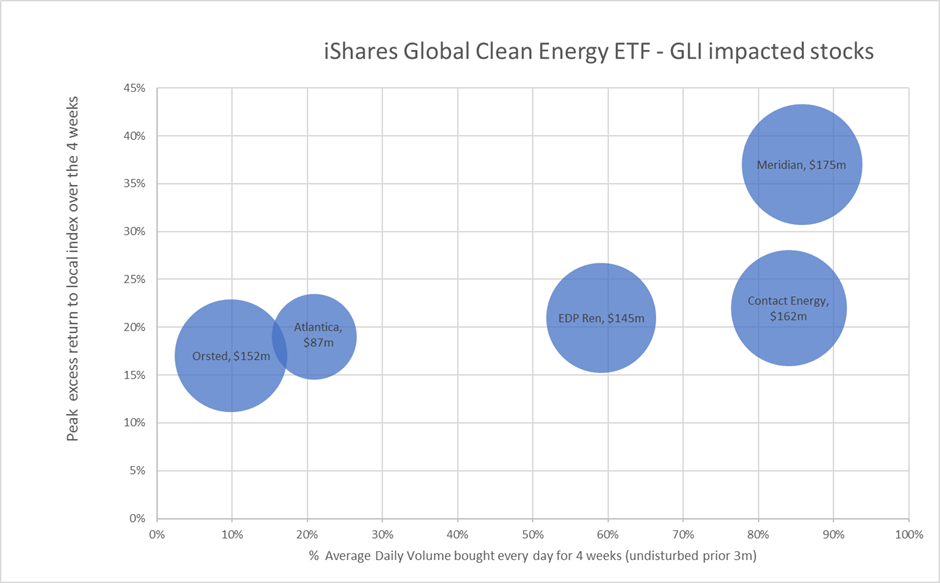
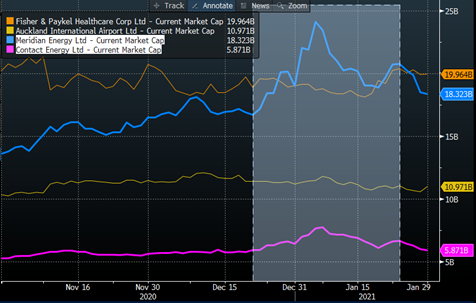
For two dual-listed New Zealand stocks, Meridian Energy (ASX:MEZ) and Contact Energy (ASX:CEN), the flows were even more eye-watering – 86% and 84% of ADV respectively bought each day for an entire month, and a net purchase of 1% and 5.8% of the entire free-float shares outstanding in the company. This led to a material appreciation in the share price – and Meridian (see Chart 5) even had the honour of being the largest market capitalisation in New Zealand by 25% for the period of buying! During the month, these five GLI universe stocks had excess returns over their local index of between 19% and 37%.
So what does this all mean?
The ability of ETFs to manifest dislocations in underlying holdings is not a new phenomenon, but for the GLI universe – typically considered a defensive, low-volatility, highly predictable regulated asset class – this was most definitely a new phenomenon. Furthermore, often these dislocations feed on themselves, with the rapid rise in underlying share prices pushing up the price of the ETF, encouraging more investors into the ETF, driving more buying of the underlying – and so on, the cycle continues. Herein lies the dilemma of the tail wagging the dog – and stock prices moving beyond fundamental valuations.
For an asset class used to investing based on highly detailed long-term discounted cashflow models, predictable cashflows and assessing regulatory models to invest capital, this adds a new dynamic for an active investor to navigate. The strategy of the Horizon Fund at Coaster Capital is to take an active approach to GLI that can recognise these dislocations, and is able to take advantage of these as they present themselves, on both the long and short side.
During January, the fund had positive contributions to performance from active short positions in several of these GLI-impacted stocks. As investors continue to attempt to anticipate ETF flows and their impact on stocks, as well as potential changes to the underlying index methodology, the impact of these ESG ETF flows should continue well into 2021. This is another illustration of the alpha and diversification benefits of the Horizon Fund taking an active, long-short approach to the GLI sector.
The information contained in this article has been prepared by Coaster Capital Pty Ltd ABN 635 699 080 (‘Coaster Capital’) operating under the Corporate Authorisation No. 001279156 from Quay Fund Services AFSL No.494886. This article is given to only ‘wholesale clients’ (as defined in the Corporations Act 2001 (Cth)) or other eligible investors as defined by their relevant jurisdiction. By attending or reviewing this article, you are representing that you are a ‘wholesale client’ or eligible investor and that you will keep this article and the information therein confidential including not to provide it to retail clients.
This article does not take into account the objectives, financial situation or needs of any particular person. The information in this article is intended only for purposes of giving you a general understanding of an investment in the Coaster Multi-Strategy Fund or the Horizon Fund (together ‘the Fund’) and is not intended to be a definitive statement on the subject matter nor should be relied upon in making a decision to invest in the Fund. Persons should rely solely upon their own investigations in respect of the subject matter discussed in this article. An investment in the fund carries potential risks and fees which are described in the applicable offering document.
Any forward looking statements, opinions and estimates provided in this article are based on assumptions and contingencies which are subject to change without notice. Forward looking statements including projections and estimates are provided as a general guide only and should not be relied upon as an indication of the future performance of the Fund.
No representations or warranties, express or implied, are made as to the accuracy or completeness of the information, opinions and conclusions contained in this article. In preparing this article, we have relied upon and assumed, without independent verification, the accuracy and completeness of all information available to Coaster Capital. To the maximum extent permitted by law, neither Coaster Capital nor its directors, employees or agents accept any liability for any loss arising in relation to this article. Neither Coaster Capital nor any other person guarantees the investment performance, earnings or return of capital invested in the Fund.
This article does not constitute an offer to sell or a solicitation of an offer to buy interests or securities in any jurisdiction to any person to whom it is unlawful to make such offer or solicitation.