Monday 12th October 2026
The number nobody tells you: why your fund's return isn't your return

Morningstar’s investor return gap shows fund returns and investor returns diverge, and advisers should measure both time-weighted and money-weighted outcomes.
Somewhere between a fund fact sheet and an investor’s account balance, a return goes missing.
No one steals it. No regulator investigates it. It simply emerges in the gap between how a fund performed and how its investors actually experienced that performance.
Morningstar calls this the investor return gap. Its 2026 Mind the Gap study found that, over the ten years to 31 December 2025, the average dollar invested in US mutual funds and ETFs earned 8.7% a year. The average fund in the sample returned 9.9% a year.
That 1.2 percentage-point annual difference may sound modest. It is not. Morningstar estimates that the resulting difference in realised investor outcomes was approximately US$3.8 trillion relative to a hypothetical buy-and-hold outcome of nearly US$35 trillion.
This is not principally a story about bad funds. It is a story about two valid measures of return that answer entirely different questions and an industry that overwhelmingly markets only one of them.
Two clocks, two truths
Every fund fact sheet, platform report and product comparison table is built around a time-weighted return.
That is not wrong. It is the appropriate measure for assessing the investment manager, strategy or portfolio itself. Time-weighted return strips out the effect of cash flowing in and out, allowing investors to judge whether a manager added value independent of when investors happened to buy, sell, contribute or withdraw.
But that is not how real investors experience markets.
Real people make contributions over time. They withdraw money for a renovation or retirement income. They switch investment options after a sharp market fall then sell after a difficult period and return after markets have already recovered.
Those decisions affect how much money was invested during each period of return.
That is what a money-weighted return captures. Often expressed as an internal rate of return, it measures the return earned on the dollars an investor actually had at risk, when they had them at risk.
The distinction is simple:
The time-weighted return tells you how the strategy performed.
The money-weighted return tells you how the investor performed.
Both measures matter. But they answer different questions.
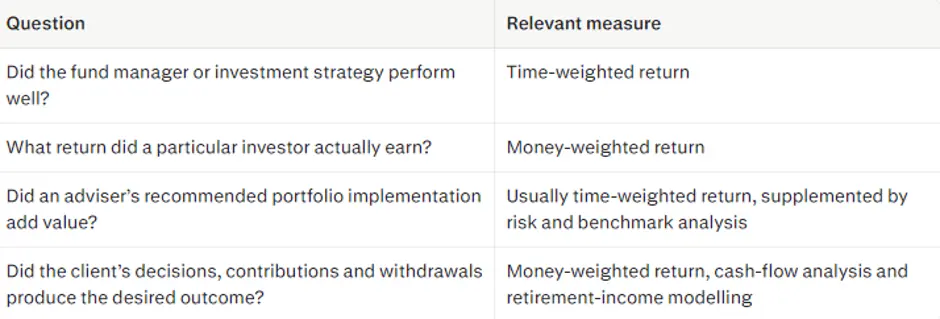
The problem is not that the industry reports time-weighted returns. The problem is that it too often treats them as if they describe the investor’s lived result.
Where the investor return gap widens
The investor return gap is not evenly distributed across markets or fund categories.
Morningstar’s analysis found that US equity fund investors came relatively close to capturing their funds’ returns: investors earned 12.8% a year against a 13.3% fund return, a gap of 0.4 percentage points.
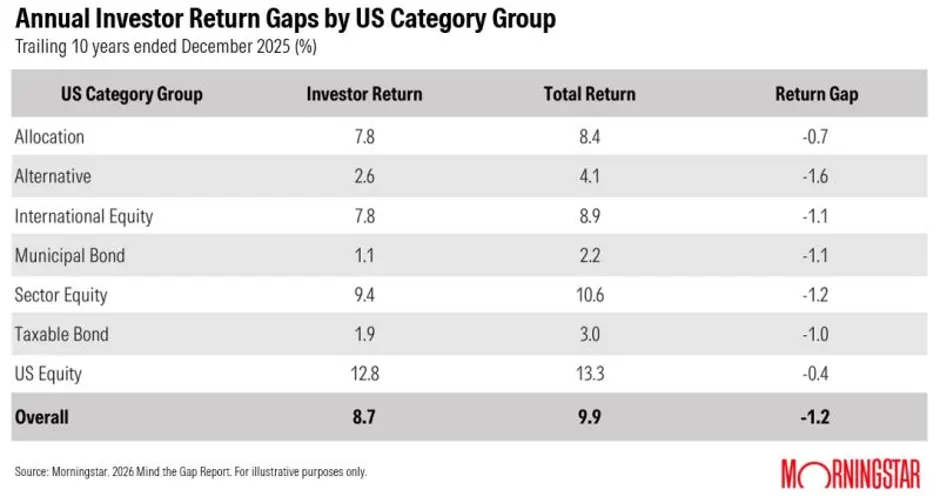
Diversified allocation funds also produced comparatively narrow gaps. That should not be surprising. Diversification, automatic rebalancing and target-date-style structures reduce the number of emotionally charged decisions an investor must make.
At the other end of the spectrum were categories that tend to be more volatile, more specialised or harder to understand:
- Alternative fund investors earned 2.6% a year while the underlying funds returned 4.1%, a 1.6 percentage-point gap.
- Sector equity investors gave up 1.2 percentage points a year.
- Municipal-bond fund investors gave up 1.1 percentage points a year.
- Crypto-linked ETFs showed an especially extreme shortfall, with Morningstar estimating an investor-return gap of about 14 percentage points.
The pattern is not accidental. It has persisted through different market environments and across multiple rolling ten-year periods.
The gap is structural because investor cash flows are structural.
Volatility is the trigger
The usual explanation is that investors buy high and sell low. That is part of the story, but it is incomplete.
Morningstar’s work suggests volatility is the more important driver. The more dramatic the journey, the harder it is for investors to stay invested long enough to receive the destination promised by the long-term return chart.
A fund that compounds steadily at 8% a year attracts little reaction. It is boring, and boring is often behaviourally useful.
A fund that falls 20%, rallies 30%, dominates headlines, attracts inflows, disappoints and then falls sharply again is a different proposition. It turns investment into an emotional obstacle course.
The categories with the largest investor-return gaps are therefore not always the worst investments. Often, they are the investments with the most dramatic narratives, the least familiar risk exposures or the hardest periods to endure.
A wide gap is not proof that a strategy is poor. It is evidence that the strategy may be difficult to hold.
That distinction matters.
Behaviour is not the whole story
There is an important contrarian wrinkle.
A 2026 Financial Analysts Journal paper argued that the widely cited 1.2% investor-return gap may overstate the cost attributable specifically to poor investor timing. Using the same underlying sample, the paper estimated the behavioural component at closer to 0.10% a year.
The disagreement is not about arithmetic. A time-weighted return and a money-weighted return will differ whenever the timing and size of cash flows differ.
The disagreement is about attribution.
How much of the gap reflects investors panic-selling, chasing performance or changing strategy at the wrong time? And how much reflects the normal mechanics of investment markets?
Those mechanics include:
- New money flowing into funds after periods of strong performance
- Funds becoming large only after their best historical returns have occurred
- Systematic contributions during rising or falling markets
- Institutional cash flows and rebalancing activity
- The growth and decline of investment categories over time
- The difference between a fund’s inception-to-date history and the experience of the dollars actually invested in it
That is an important qualification. The investor return gap is not simply a morality tale about irrational retail investors.
Part of the gap is behavioural and part is mechanical, and the rest is the natural consequence of money arriving over time rather than being invested as a single lump sum on day one.
But the core lesson survives the debate: a fund’s reported return and the return earned by its investors are different measures, derived from different conventions, and neither should be mistaken for the other.
The Australian superannuation issue
The implications are especially relevant in Australian superannuation.
Most superannuation members do not make a single investment and leave it untouched for a decade. They receive compulsory employer contributions, make voluntary contributions, consolidate accounts, change investment options, move into pension phase and alter drawdown rates.
A MySuper option return or diversified investment-option return remains essential. It allows trustees, advisers and members to compare investment implementation and manager performance on a consistent basis.
But it does not tell a member what they personally earned.
For an individual approaching or living in retirement, the outcome is shaped by far more than the published investment-option return:
- The timing of contributions and withdrawals
- Investment-option switches
- Sequence risk around retirement
- Pension drawdown rates
- Fees, tax and insurance premiums
- Cash holdings and liquidity decisions
- The extent to which the portfolio was maintained through market stress
A member can be invested in a high-performing option and still experience a disappointing personal outcome if their cash flows and switching decisions were poorly timed.
Conversely, a member may report a lower money-weighted return than the option’s headline number simply because most of their balance was accumulated later in the measurement period. That is not necessarily a failure of behaviour, advice or product design.
It is why advisers must distinguish between assessing a portfolio and assessing a client outcome.
Why simplicity often wins
The recurring lesson from Morningstar’s work is not that investors should avoid all complexity, active management or alternatives.
It is that investments should be assessed not only by their expected return, diversification properties or historical risk-adjusted performance, but also by their behavioural holding cost.
- Can the client understand it?
- Can they tolerate the drawdowns?
- Can they remain invested through a period when the strategy is unfashionable, misunderstood or performing poorly relative to a simple benchmark?
- Can the adviser explain why the strategy remains appropriate when it is hardest to defend?
Broad diversification, systematic contributions, rules-based rebalancing and appropriately designed withdrawal arrangements do not eliminate risk. They reduce the number of moments when an investor can make a costly emotional decision.
That is why seemingly “boring” structures often produce better realised outcomes. They may not maximise theoretical return, but they can increase the proportion of return that investors capture.
The best portfolio is not necessarily the one with the highest expected return. It may be the one a client can stay invested in.
What advisers should measure
For advisers, platforms and product issuers, the practical implication is not to abandon time-weighted return.
It is to stop treating it as the complete answer.
A better reporting framework would separate investment implementation from investor experience:
- Use time-weighted returns to assess managers, portfolios, investment options and benchmark-relative performance.
- Use money-weighted returns to assess the client’s actual experience, particularly where there have been material contributions, withdrawals or switching decisions.
- Review cash-flow timing after major portfolio changes, retirement transitions, inheritances, business sales or periods of market stress.
- Design for holdability, considering drawdown tolerance, liquidity, complexity and the client’s capacity to remain invested.
- Automate good behaviours through regular contributions, rebalancing rules and structured retirement-income processes.
- Treat a large investor-return gap as a due-diligence signal, not a simplistic scorecard. It may identify a product that is difficult to hold, difficult to explain or especially vulnerable to poorly timed flows.
The fund return remains important. It tells us whether the investment strategy did its job.
But investors do not retire on a time-weighted return. They retire on the dollars that remain after the contributions, withdrawals, switches, drawdowns and decisions of a lifetime.
That is the number the industry should be more willing to show.

Ben is a principal consultant at WealthVantage Partners and is an expert in research for the financial advice ecosytem.