Thursday 12th November 2026
Three signals that have historically marked a floor for gold

World Gold Council research identifies three signals that have preceded gold’s recoveries, and argues the economic backdrop shows whether a sell-off is a correction or a longer slide.
Gold has earned a firmer place in client portfolios as a diversifier, and with that comes a familiar conversation whenever the price falls sharply from a high. Clients want to know whether the weakness is a correction or the start of a longer decline, and whether it represents an opportunity to add.
Research from the World Gold Council, led by Johan Palmberg, senior quantitative analyst at the council, offers a simple framework for that conversation. Rather than trying to pin down a precise price floor, it looks at the conditions that were in place when gold recovered during past downtrends and finds three that stand out.
Three signals
Unlike most commodities, gold has no cost of production that tells investors where a floor might sit, and the council notes that, much as with equities, “fair value is a poor timing tool”. Its research instead focuses on bear regimes over the past 20 years, defined as periods when gold’s 50-day moving average has stayed below its 200-day average for at least a month.
After testing a broad set of candidate indicators, including real yields, credit spreads, copper, crude oil, money supply and options positioning, the council found three that proved the most useful. Each is treated as a signal when its reading falls among the most extreme 30 per cent of bear-regime months, and each captures a different part of a sell-off.
The first is dislocation, with gold trading well below its 200-day moving average, which measures how stretched a sell-off has become. The second is a sharp rally in the US dollar relative to the previous 52 weeks, which the research reads as an encouraging sign rather than a worrying one.
“When gold has fallen because the dollar has spiked, the weakness has tended to be temporary, reflecting perhaps currency moves rather than weaker gold demand,” the research observes.
The third is a positioning washout, where speculative futures positions, combining managed money and smaller traders, fall to unusually low levels relative to open interest.
“Rallies need fuel, and once the weaker speculative holders have sold, there are fewer sellers left.”
What the history shows
On its own, gold trading well below trend has been a reasonable guide to forward performance, but the results improve markedly as the conditions stack up. Across 24 bear-regime observations since 2005, gold’s median return over the following three months was 3.2 per cent, with gains 63 per cent of the time. Where at least two of the three conditions were present, the median return rose to 4.2 per cent and nine of the 10 episodes were positive.
In the five episodes where all three conditions aligned, in October 2008, May 2012, November 2015, December 2016 and September 2022, gold was higher three months later every time, with a median return of 9.8 per cent.
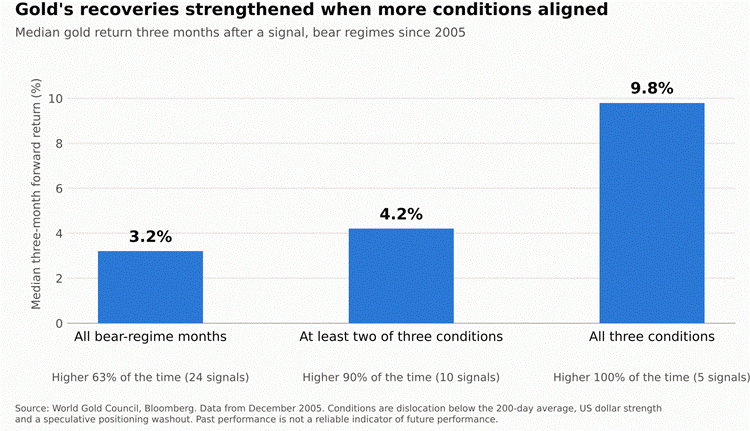
The council is clear that the sample is small and that the framework speaks only to the next three months. “This framework is not a trading rule and isn’t meant to encourage tactical trading,” the research notes, describing it instead as a simple heuristic for judging whether a sell-off is starting to look stretched.
Context matters more
For the longer view, the council argues that the macroeconomic and fundamental backdrop carries more weight than any short-term signal. That is why it cautions against assuming every sharp fall will follow the path of the multi-year decline that came after gold’s 2011 peak.
“The post-2011 multi-year sell-off came amid conditions that were far less favourable for gold,” the research observes. In September 2011, US 10-year real yields sat at just 0.1 per cent with little room to fall, the US dollar had already dropped 18 per cent from its June 2010 high and had room to rally, and bonds were a reliable hedge against equity weakness. Central bank net buying was also running at around 500 tonnes a year, well below the pace seen in more recent years.
Real yields, the level of the dollar, how well bonds are hedging equities, inflation expectations, geopolitical risk and the pace of central bank buying together form a practical checklist for judging whether a pullback looks more like a correction than the start of a prolonged downtrend.
Strategic demand
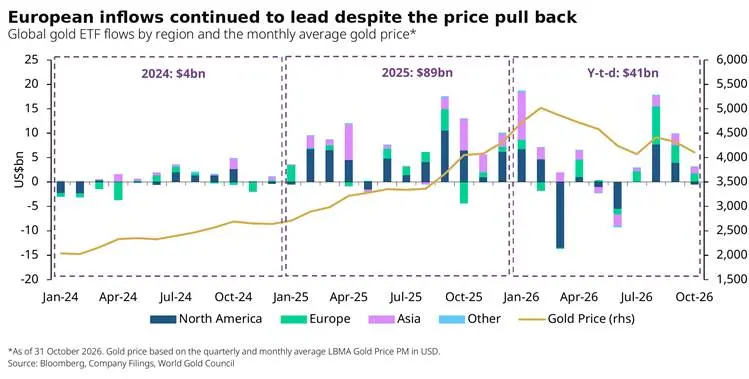
Flows into physically backed gold ETFs offer a further read on investor behaviour. Global gold ETFs attracted US$89 billion in 2025, according to the council’s data, and through periods of price weakness in 2026 European and Asian investors continued to add to their holdings.
European-listed funds recorded 18 consecutive weeks of net inflows even as the gold price softened and bond yields across the region rose.
“This suggests that demand for gold ETFs may be increasingly strategic, reflecting persistent political and fiscal uncertainty across the region,” the council notes.
Even outflows can reflect one of gold’s strengths. When equity markets come under pressure, some investors turn to their gold holdings as a ready source of liquidity, which the council sees as a reminder that “deep liquidity can help investors meet cash needs during market turbulence”.
Over the long run, gold has returned close to 9 per cent a year since 1971, and the council observes that for strategic investors, averaging into weakness has historically made sense.
“So the more useful question is not where the floor is, but whether weakness is becoming an increasingly attractive opportunity to add,” the research concludes, a framing that sits comfortably within client conversations about gold’s role as a long-term diversifier.

Joel is a contributor and content manager at The Inside Network.