Thursday 7th May 2026
Daily Market Update: 7 May 2026

Australian market
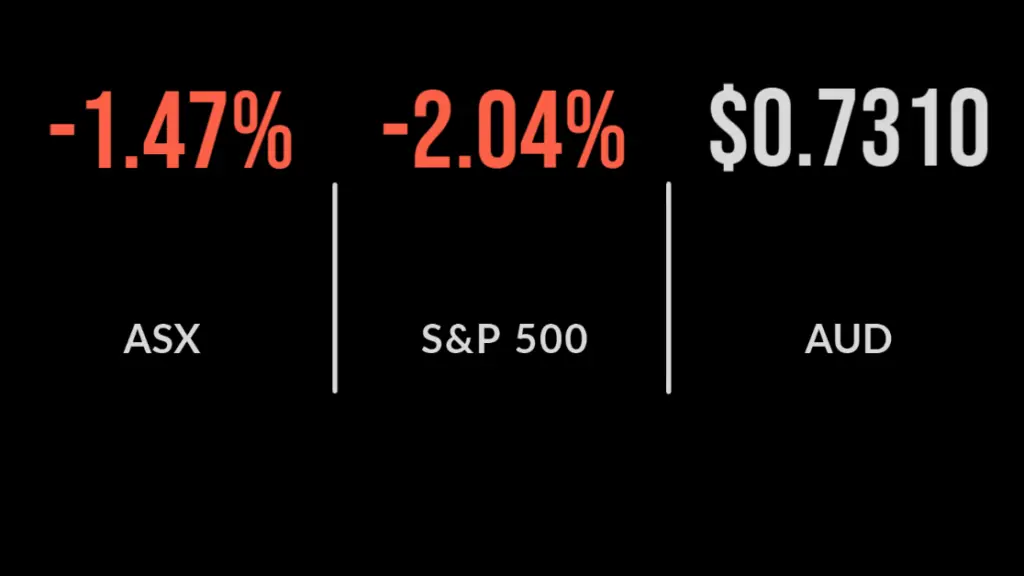
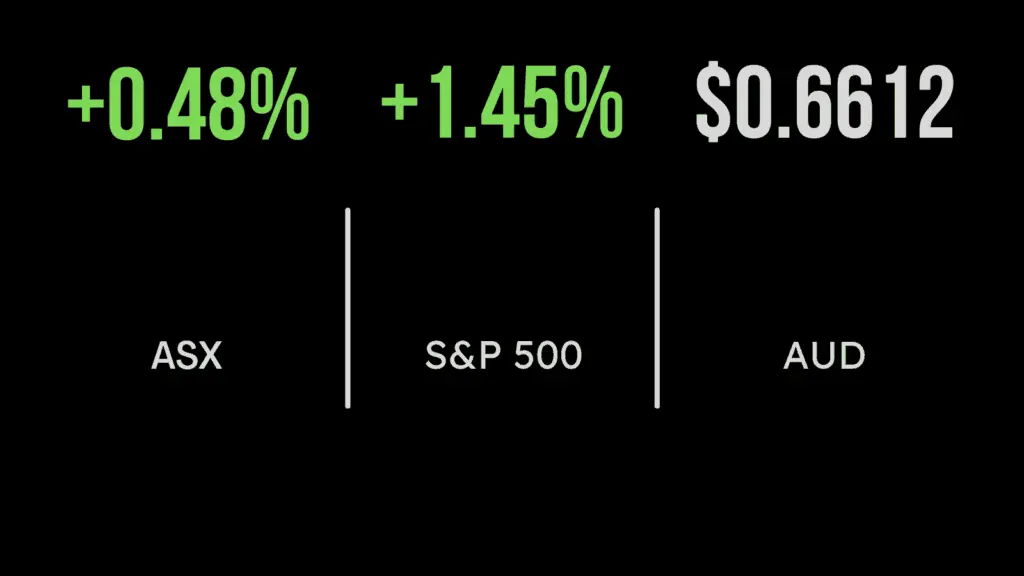
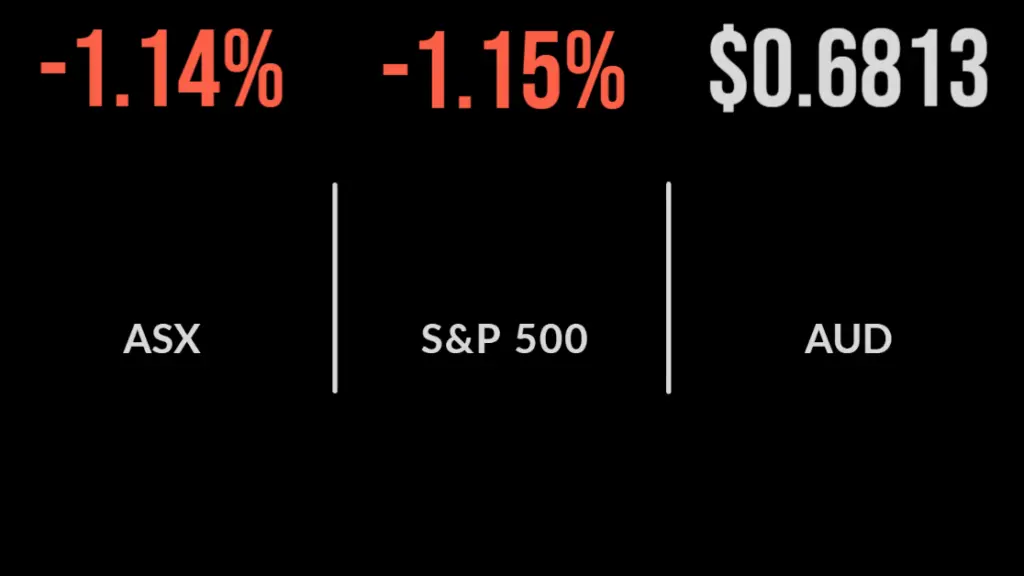
S&P/ASX 200 Index (ASX: XJO) rebounded strongly on Wednesday, climbing 113.1 points, or 1.3 per cent, to close at 8793.60 as investors welcomed signs that the United States may be seeking a diplomatic resolution to the conflict with Iran. The rally marked the benchmark’s strongest daily performance since April and was supported by robust gains on Wall Street overnight, particularly in technology stocks tied to artificial intelligence. Investor sentiment improved after reports emerged that the United States had paused naval escort operations in the Strait of Hormuz to encourage peace negotiations, easing concerns over a prolonged disruption to global oil supplies and inflation pressures.
Australian banks led following RBA Rate Decision
Financials led gains, with Commonwealth Bank of Australia (ASX: CBA) up 3 per cent, Westpac Banking Corporation (ASX: WBC) rising 3.5 per cent, ANZ Group Holdings Limited (ASX: ANZ) gaining 3.1 per cent and National Australia Bank Limited (ASX: NAB) adding 2.8 per cent; however, energy names fell as oil eased, with Woodside Energy Group Limited (ASX: WDS) down 2.7 per cent, Santos Limited (ASX: STO) off 0.3 per cent and Ampol Limited (ASX: ALD) losing 1.2 per cent.
US Technology and Artificial Intelligence Shares Lift, Oil Retreats
United States equities rose on peace hopes and strong artificial intelligence earnings, with the S&P 500 Index (NYSE: SPX) and Nasdaq Composite Index (NASDAQ: IXIC) both up more than 1 per cent to record highs, while the Dow Jones Industrial Average (NYSE: DJI) added 600 points; Advanced Micro Devices, Inc. (NASDAQ: AMD) surged 20 per cent, Super Micro Computer, Inc. (NASDAQ: SMCI) rose 15 per cent, and The Walt Disney Company (NYSE: DIS) and Uber Technologies, Inc. (NYSE: UBER) also advanced.
| Australian Indices | Daily % | Weekly % | 1 Month % | 3 Month % | 1 Year % |
| ASX 200 | 1.3 | 1.2 | 2.5 | 2.1 | 11.0 |
| Financials | 2.3 | 2.5 | 2.7 | 4.9 | 14.3 |
| Resources | 1.7 | 0.7 | 3.8 | 10.4 | 54.7 |
| Information Technology | -0.7 | 1.5 | 10.9 | 1.4 | -20.7 |
| Global Indices | Daily % | Weekly % | 1 Month % | 3 Month % | 1 Year % |
| US 500 | 1.5 | 1.0 | 6.1 | 2.4 | 31.2 |
| Europe | 0.9 | 0.6 | 0.0 | -3.7 | 7.7 |
| Japan | 1.3 | -0.3 | 1.2 | -1.2 | 15.6 |
| China top 50 | 0.2 | -1.4 | -0.6 | -7.3 | -2.8 |
| India top 50 | -0.1 | -1.8 | -1.4 | -12.1 | -20.5 |
| Fixed Interest | Daily % | Weekly % | 1 Month % | 3 Month % | 1 Year % |
| Australian Treasury Bond | 0.0 | 0.3 | 0.8 | 0.2 | 0.0 |
| Australian Corporate Bond | -0.2 | 0.3 | 0.9 | 0.2 | 0.8 |
| US Treasury | 0.2 | -0.3 | 0.3 | -0.4 | 2.8 |
| Cash | 0.0 | 0.1 | 0.4 | 1.0 | 3.8 |
| Commodities & Crypto | Daily % | Weekly % | 1 Month % | 3 Month % | 1 Year % |
| Gold | 1.2 | 0.5 | -5.2 | -9.9 | 20.9 |
| Silver | 2.3 | 0.2 | -0.6 | -4.6 | 100.0 |
| Crude Oil | -4.1 | -4.2 | -2.1 | 79.4 | 115.8 |
| Bitcoin | -1.1 | 5.0 | 17.0 | 14.9 | -25.2 |