Thursday 8th October 2026
Concentration in the S&P 500 is an outcome, not a design choice
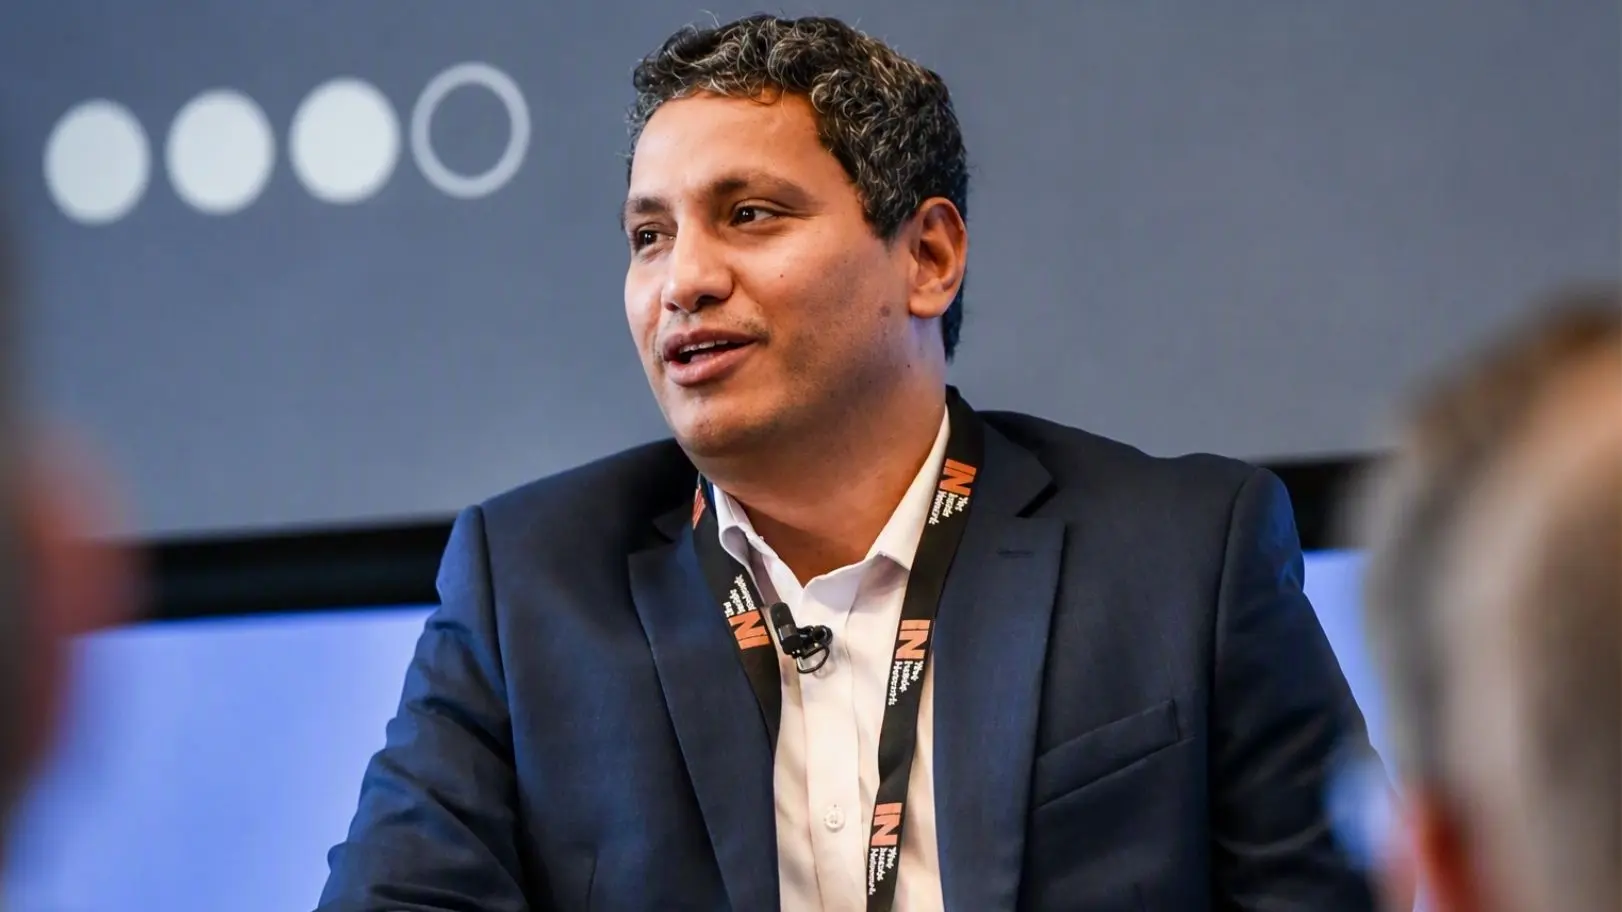
S&P Dow Jones Indices’ Amit Pathak says the index’s top 10 weight has more than doubled in a decade because US earnings concentrated first, and that the decision about how much of it a client owns belongs to the adviser rather than the index.
The 10 largest holdings in the S&P 500 have grown from about 18 per cent of the index to close to 40 per cent over the past decade. The question that follows, and the one advisers are being asked about S&P 500 concentration risk, is whether the index did that or the American economy did.
Amit Pathak, head of US equity product management for Asia-Pacific at S&P Dow Jones Indices, argues it is the second, and that indices are not built to tip weight towards their largest names.
“It is a structural feature, not an index design, and it is the vote of confidence of market participants.”
Understanding S&P 500 concentration risk
His evidence is profitability. US technology companies run operating margins of around 27 per cent, against about 9 per cent for global companies excluding the US. In communications the comparison is roughly 23 per cent against 14 per cent.
The pattern holds across most sectors, and about 50 of the world’s top 100 brands sit inside the S&P 500. The most profitable companies in the world are in those sectors, and those companies are in the top 10, so the earnings concentrated before the index did. Adoption of AI, cloud computing and digital transformation is the mechanism, and the flows followed rather than caused it.
Scale is the other half of the picture. The S&P 500 is more than 30 times the size of the Australian market. The nearest comparison by company size is the S&P 600, which covers US small caps. The sector mix is barely comparable either. Information technology and communications dominate one, mining and real estate weigh heavily on the other.
On the concentration itself, Pathak notes that the Australian market is more concentrated than the US. He also notes that plenty of US indices are more concentrated than the S&P 500.
Inclusion criteria
“The S&P 500 is not just about the 500 largest companies in the US, or the most popular companies in the US.”
Inclusion runs through financial viability, market capitalisation, seasoning, profitability, liquidity and tradability, assessed by an index committee that also weighs sector composition and consults the market before significant changes.
Whether an S&P 500 exchange traded fund would attract flows is not part of it. That is why the private technology companies advisers get asked about, SpaceX among them, are not in the index despite their valuations.
Pathak is equally firm on the charge that index money distorts prices, and the arithmetic is on his side. For example, a $100 investment in an index fund/ETF tracking the S&P 500 buys each holding at its index weight, no more and no less.
“So passive is not distorting the market. It is the marginal active player who decides the price and weight of the stock.”
The arithmetic is right in general, with the obvious caveat that entering or leaving an index still moves a stock price. The larger caveat is that explaining why concentration happened does not settle what it means for a portfolio.
What it means for portfolios
A 40 per cent top 10 weight is the practical face of S&P 500 concentration risk, making a client’s outcome depend on fewer companies, whatever produced it. Margins of 27 per cent are a level rather than a promise. High returns on capital attract competition. The current capital expenditure cycle in AI is consuming a good deal of the cash flow that generated those margins in the first place.
This is where understanding the clients’ needs comes to the fore. Capped and equal weighted versions of the index exist. They attract inflows when volatility rises, as they did during this year’s flare-up in the Middle East.
The Dow Jones Industrial Average offers 30 old economy names for portfolios that want less technology. The 11 sector indices allow a deliberate overweight or underweight. Their leadership rotated inside six months, with energy leading the first quarter before technology took it back in the second.
The index reports what the market has decided. How much of that a client should own is a separate decision, and it is not one the index makes.

Laurence Parker-Brown is head of content at The Inside Network and managing editor of The Inside Adviser and Investor Strategy News.