Friday 5th June 2026
GARP index gives advisers a new frame for offshore equity exposure
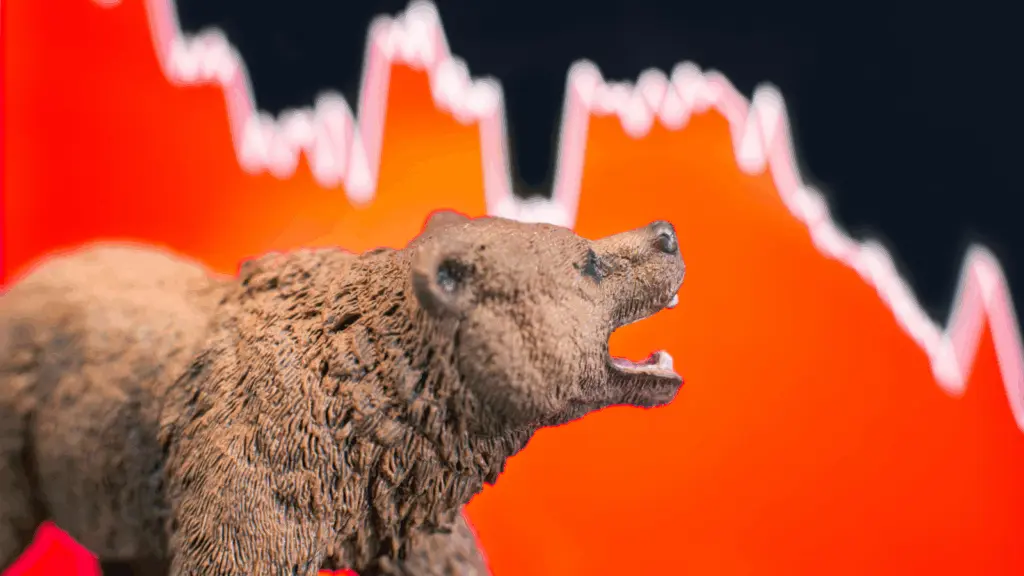
A new GARP Index gives advisers a portfolio construction tool that blends global growth, quality and valuation discipline, although currency, turnover and factor cyclicality remain live considerations.
With so many client portfolios having a healthy allocation of domestic stocks, many advisers are seeking to offer great levels of exposure to global growth assets. With markets close to all-time highs, the next challenge becomes achieving growth without abandoning valuation discipline.
Enter the S&P Dow Jones Indices World Ex-Australia GARP Index as a portfolio construction tool to reconcile these goals. The index, launched in August 2024, applies a growth-at-a-reasonable-price framework to developed-market equities outside Australia.
The index starts with the S&P World Ex-Australia Index, screens for growth, applies quality and value filters and arrives at 250 constituents across more than 20 developed markets.
A portfolio construction answer to home bias
Australian portfolios remain structurally tilted to domestic banks, miners and income stocks, while many clients still need broader offshore exposure.
S&P DJI modelling shows a hypothetical portfolio combining 90 per cent S&P World Ex-Australia GARP with 10 per cent S&P/ASX 200 outperformed a 100 per cent ASX 200 allocation by 374 basis points annually. It also reduced volatility by 173 basis points.
Jason Ye, senior director at S&P Dow Jones Indices, said the methodology deliberately begins with growth before applying valuation and quality controls.
“The index name is ‘growth at a reasonable price’, which indicates that growth comes first. The objective is to first look at a group of growth stocks, then within that group, we look at valuation and quality considerations.”
The first screen ranks companies by a composite growth score using three-year earnings-per-share growth and three-year sales-per-share growth. Ye said the three-year period was chosen for methodological consistency, rather than because it was uniquely predictive.
“There’s no magic behind the three-year window,” he said. “It’s just a common practice following how we construct style indices like the S&P 500 Growth or the S&P/ASX 200 Growth. Intuitively, one year might be too short and five years might be too long.”
He added that S&P DJI tested other measures. One of these measures include forward-looking analyst consensus growth but found they did not materially change the back-tested result.
“We did some stress tests using slightly different growth measures or even using the forward-looking sell-side consensus growth measures, which didn’t materially affect the backtest result,” Ye said.
After the growth screen, the index applies a composite quality and value score using financial leverage, return on equity and earnings-to-price. That produces a lower P/E than the benchmark, 19.6 times versus 24.0 times, alongside stronger profitability and lower long-term debt.
Growth first, price second
That is the crux of the proposition for advisers, global growth exposure, but with a filter designed to avoid paying any price for it.
Ye said the contribution of the three secondary factors varies over time.
“It kind of depends on which period you look at, as these three factors have their own performance cycles,” he said. “Leverage and ROE tend to be more quality-focused, while E/P tends to be more valuation-focused.”
The index weights stocks by float market capitalisation multiplied by growth score, subject to stock and sector caps. Ye noted this matters in a global index, where pure growth-score weighting risks pushing the portfolio too far from its benchmark.
“Using pure growth weighting would result in something leaning towards equal weight, which would likely result in underweight against the US market,” he said. “Also, when designing a cross-market index, having the float market cap element is helpful in managing the level of deviation against the underlying benchmark, tracking error.”
The caveats advisers need to explain
The long-run numbers are strong but need careful framing. S&P DJI’s back-tested data from July 2004 to February 2026 shows the GARP index outperforming its benchmark by 3.61 percentage points per year, with a perfect hit rate across every 10-year rolling window. But the index itself only launched in August 2024, meaning most of the performance record is hypothetical.
There are also practical considerations. The briefing notes average annual one-way turnover of around 60 per cent. Implementation costs, tax drag and product fees will matter. Currency is another live decision, with the index exposed mainly to the US dollar, euro and yen. The hedged version outperformed over one year but lagged over five years, underscoring that hedging is not a free lunch.
Nor is the index defensive. S&P DJI’s data shows it has tended to do better in rising markets, although it still delivered modest average excess returns in down markets. Ye said the pro-cyclical bias is inherent in the design.
“The growth element,” he said, when asked what explains that behaviour. “If it’s pure quality or pure value, then the strategy would tend to be more defensive in nature, but the index construction starts with a growth universe, so that would make it more pro-cyclical.”
Within a broader portfolio, the index sits most naturally as a core-adjacent global equity sleeve rather than a defensive substitute. The pitch is not that GARP removes equity risk. It is that it gives clients a cleaner way to own offshore growth, filtered for quality, valuation and portfolio discipline.

Laurence Parker-Brown is head of content at The Inside Network and managing editor of The Inside Adviser and Investor Strategy News.